There are a lot of design metrics to consider for your upcoming product, but sometimes it can be hard to know which ones to choose.
The five best user experience design metrics are based on their simplicity, accessibility, and social cues.
With these in mind, this will help you create a product that is intuitive for all users, is easy to use and think about, and will make your customers happy.
Ideally, you want to choose only a few key metrics to turn raw data into insights. However, what if there’s too much data or if your team hasn’t identified the product metrics just yet.
After all, the user experience should connect dots between business objectives and ensure the user experience is top-notch. When you have a clear picture of what your customers are doing and why they’re doing it, you can repeatedly be successful, and thus, your product team will know how to improve.
So, have you started to track your product metrics yet?
With the correct metrics that make sense for your business and product, your team can transition from working in isolation to making a cross-functional collaboration in reality. Hence, this means that improvements can be made for your product to evolve.
In order to ensure uniformity and quality, while simultaneously reducing miscommunication or ambiguity. Create SOPs (Standard Operating Procedures) to provide step by steps instructions to team members to save hundreds of hours of budget and time trying to improve the user experience (UX).
Learn how easy it is to create a step-by-step guide for your user experience design process with Flowster. You’ll be able to produce the best results possible, have an easier time updating your UX design, and get more done in less time!
For example, here is a template on User Testing – Finding the Best User to Test Your Product. It can easily be assigned to a team member or virtual assistant.
Well, let’s not waste any more time and get directly to the point. In this article, we will show you the five best UX design metrics for optimizing your product teams.
5 UX Metrics Your Product Team Should Pay Attention To
1. Customer Satisfaction Score (CSAT)

A customer satisfaction score (CSAT) measures how satisfied your customer concerns your product, specific features, the user experience, and the company in general.
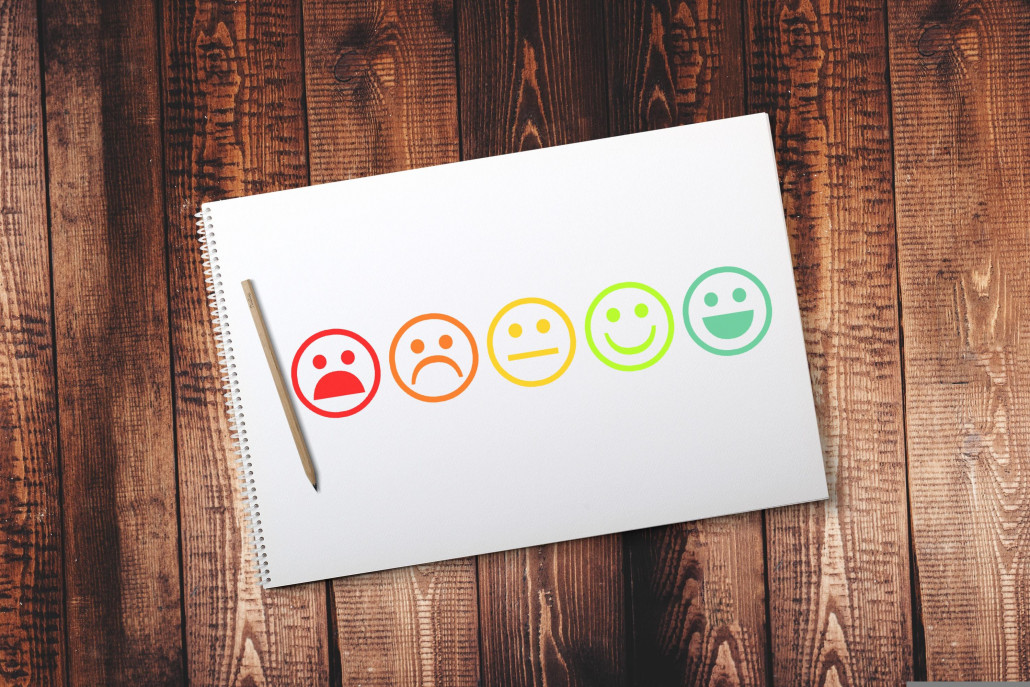
CSAT surveys include asking questions such as “did our product satisfy your needs?” and answers usually consist of a yes or no, or even a sad face.
Of course, scores will vary on your product and services, but a sudden drop in scores can indicate that your product needs vast attention for improvement. Thus, a decrease in scores will also directly impact your onboarding time.
CSAT is excellent in connecting customer satisfaction to crucial moments during the user experience. So, picking the right moment matters a lot. Moreover, you can use an on-site CSAT survey to assist you in learning about customer satisfaction:
- For subscription renewal cases
- After essential customer lifecycle moments such as upgrading their account and more
- After education moments or customer support
How to Fill the Emotional Gap Left Over from CSAT?
CSAT survey results will show you what satisfies potential customers, but you need to find out what it may be.
You can consider using an incoming feedback widget to allow customers to offer inputs beyond ratings and collect voice of the customer (VoC) data to help your product team address your customers’ pain points.
For example, maybe you’ve had a new product launch and seen a significant drop in the CSAT score. For instance, from 90% to 80%, and to investigate this drop, you can use an incoming feedback widget and encourage customers to do the following:
- Offer visual feedback based on their first impressions of your new product
- Take screenshots of their pain points
- Explain why they feel the way they do
2. Usability Scale and Testing
Usability metrics focus on how easy it is for people to accomplish what they have an intention to do so. UX teams’ usability metrics include the task success rate, ease of use, and task time.
Usability testing is the core of success and aims to reduce the learning time to reduce abandonment rates. You can read this usability testing guide by Maze to learn more!
Moreover, we have a System Usability Scale which provides a quick way of assessing system usability. It includes ten different items in a questionnaire, and usually, responses include the Likert scale (strongly agree and strongly disagree) for every question:
- I think I would like to use this system more often
- I found the system to be complex
- I found the system to be easy to use
- I think it would be better if I had technical support when using the system
- I found that the system was well integrated
- The system had too much inconsistency
- I think the system can be learned quickly
- The system was difficult to use
- While I was using the system, I felt confident
- I had to learn many things before getting to know the system
Usually, with the following questions, you get a usability score for your products and features, which makes it easier for the product teams to compare newer and older experiences regarding designs.
3. Real User Monitoring Metrics
Real user monitoring (RUM) is a technology that allows you to analyze and monitor customer experience when using your application or website and see how they interact with it. Furthermore, it will let you see if HTTP requests, timeouts, and crashes have occurred directly affecting user satisfaction.
Implementing RUM in your business will help your product development team give early warnings for any crashes, timeouts, long load times, errors, and more. In contrast, you can see what is affecting your user’s experience product and have the option to fix the issue before any other catastrophic failures occur.
In addition, here are some essential RUM metrics you can consider for optimal performance:
- Apdex and user satisfaction score
- HTTP requests
- Sematext experience (RUM solution)
4. Customer Effort Score (CES)

Customer effort score (CES) is a customer experience survey metric that helps your product team understand how easy it was for a customer to resolve an issue or accomplish a goal when using your product.
CES is measured through questions regarding how easy it was for a customer to use your product or website. Answers will be on a scale from 1-7, 1 being difficult and 7 being very easy. Moreover, product teams can use CES surveys to uncover pain points within the product. Experiences such as operational metrics like channel switching, repeated request transfers, and more.
How to Fill in the Emotional Gap of CES
On- and off-site surveys assist your product team in collecting VoC feedback in order to learn what the customers are thinking, how they are experiencing your product, and why they are leaving your website or abandoning your product.
5. Time Spent on Task

The time spent on a task is the core metric for finding out how efficient or productive a customer uses your product. If they are spending excessive time on a task, it’s bad news for you because something is wrong with your product.
Measuring the time spent on a task will help answer the following questions:
- Identify usability issues regarding your app or website interface
- Distinguish differences between system and customer lag time, especially when a customer experiences it during product usage
- Allows you to measure average task completion time and the time to failure (aka abandonment rate or the time it takes for a customer to give up finally).
Moreover, you can consider adding session recordings to add context to the time spent on a task by showing individual user journeys from one page to another. See what kind of experience they had with your site and how they behave on specific tasks- where they are getting distracted, frustrated, confused, and more.
Are Social Impact Metrics Important Too?
A common question is if social impact metrics are important to use. Well, what is excellent about social impact metrics is that they can distinguish what is essential, not only what is easy.
Products will always grow in a direction that we measure them. Moreover, that’s why tech companies pay a vast amount of attention to metrics and seek to win users’ trust. For instance, Facebook’s news feed metrics were changed to have meaningful social interactions instead of only finding relevant information. Additionally, YouTube’s new tools encouraged promoting what mattered most to users and eliminating what didn’t.
Considering the fact that it isn’t easy to come up with new social impact metrics, it can take quite a long time to measure outcomes. Nevertheless, it never hurts to become more intentional and be concerned about your long-term vision.
Wrapping It Up
Well, that’s about it for this article. These were our five best UX design metrics to optimize for product teams. Hopefully, you have a better understanding of what’s necessary. Also, by reading this article, you’ve generated many new ideas on what you have to do to enhance the user experience.
Take into account how your business is operating and what kind of results you are getting at the moment. Then, take those results and compare them over time, see what you can do to improve them and give your users a taste of something good, or else, they’ll turn to your competitors.
After all, user experience is above all, and the only way we can enhance it is by knowing what your audience wants and what you can do to improve it. In short, this will be a better experience for them and you in the long term and for the greater good of your business!
Do you agree with these five best UX design metrics? Or maybe we have missed other UX design metrics, let us know.
Want a Shortcut to Your First SOP?
Check out the SOP templates available in Flowster’s Marketplace.
Jump in with templates you can use out of the box, or customize them to meet your needs. (No time to customize? Take advantage of our Done For You service and have us build custom SOPs from scratch.)

